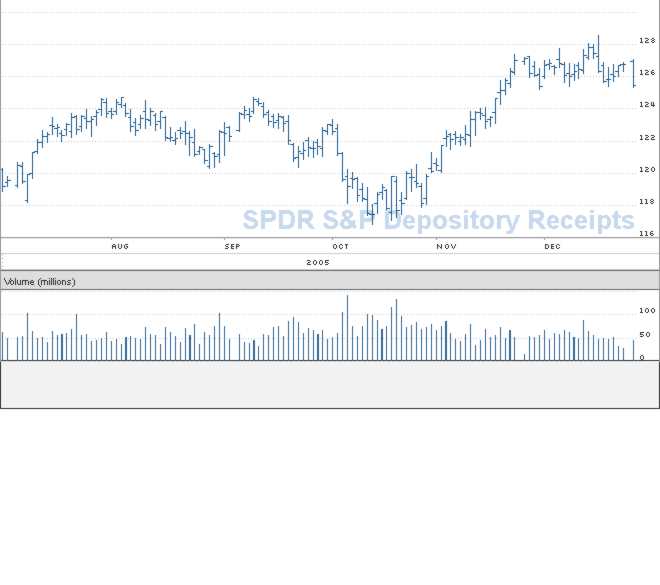
This chart is pretty scary. The S&P 500 has been in a trading zone for all of December (~127.8 to 125.8) and it doesn't seem like I seen patterns like this go on to make new highs. The market was down pretty hard today--we will see if that continues...

No comments:
Post a Comment